The real line
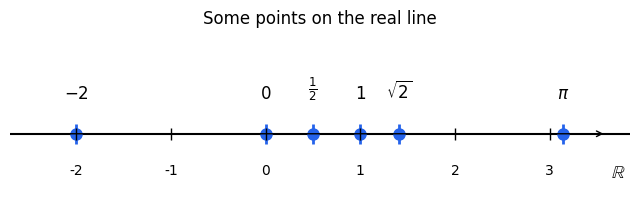
Let us recall that the real numbers could be viewed as the real line, where numbers are plotted as dots on the line.
import matplotlib.pyplot as plt
import math

values = [
    (-2, r"$-2$"),
    (0, r"$0$"),
    (0.5, r"$\frac{1}{2}$"),
    (1, r"$1$"),
    (math.sqrt(2), r"$\sqrt{2}$"),
    (math.pi, r"$\pi$"),
]

fig, ax = plt.subplots(figsize=(8, 2.2))
ax.axhline(0, color="black", linewidth=1.5)
ax.annotate("", xy=(3.6, 0), xytext=(-2.6, 0), arrowprops=dict(arrowstyle="->", color="black"))

for value, label in values:
    ax.plot(value, 0, "o", color="#2563eb", markersize=8)
    ax.vlines(value, -0.06, 0.06, color="#2563eb", linewidth=2)
    ax.text(value, 0.18, label, ha="center", va="bottom", fontsize=12)

for tick in range(-2, 4):
    ax.vlines(tick, -0.035, 0.035, color="black", linewidth=1)
    ax.text(tick, -0.18, str(tick), ha="center", va="top", fontsize=10)

ax.text(3.65, -0.18, r"$\mathbb{R}$", ha="left", va="top", fontsize=13)
ax.set_xlim(-2.7, 3.85)
ax.set_ylim(-0.45, 0.55)
ax.set_axis_off()
ax.set_title("Some points on the real line", pad=12)
plt.show()
2D and 3D Euclidean spaces
The space is the set of all pairs of real numbers. In set-builder notation, it is written as
Similar to how we visualized the set of real numbers as a line, the space can be identified with the more familiar Euclidean plane, or the two-dimensional Euclidean space. Let us recall that the two axes are called the -axis and the -axis, and that elements of can be identified with points on the plane.
import matplotlib.pyplot as plt

points = [(2, 3), (-1, 2), (3, -1), (-2, -2), (0, 1)]
colors = ["#dc2626", "#2563eb", "#16a34a", "#9333ea", "#ea580c"]

fig, ax = plt.subplots(figsize=(6, 6))
ax.axhline(0, color="black", linewidth=1.2)
ax.axvline(0, color="black", linewidth=1.2)

for (px, py), color in zip(points, colors):
    ax.scatter(px, py, s=80, color=color, zorder=3)
    ax.annotate(f"({px}, {py})", (px, py), xytext=(7, 7), textcoords="offset points", fontsize=11)

ax.set_xlim(-3.5, 4)
ax.set_ylim(-3.5, 4)
ax.set_aspect("equal", adjustable="box")
ax.set_xticks(range(-3, 5))
ax.set_yticks(range(-3, 5))
ax.set_xlabel("x")
ax.set_ylabel("y")
ax.set_title(r"Points in $\mathbb{R}^2$")
ax.grid(True, linestyle="--", alpha=0.35)
plt.show()
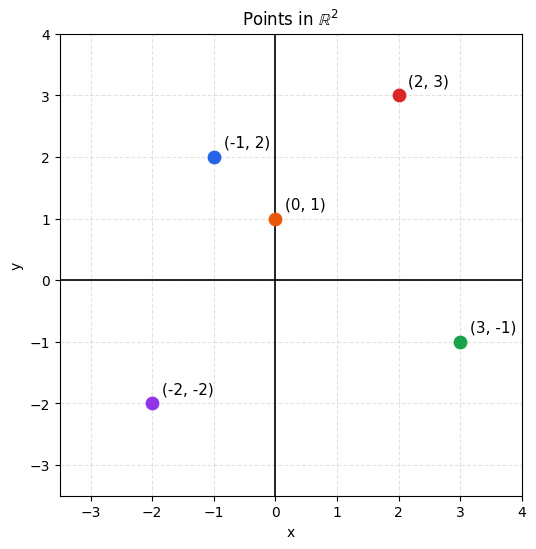
An important thing to note here is that the order of the two numbers in the pairs matter. For instance, the pair and are different elements of . This is unlike sets, where the ordering of the elements do not matter; the sets and are the same object.
In the same way, we define the space to be the collection of all 3-tuples of real numbers, which in set-builder notation is written
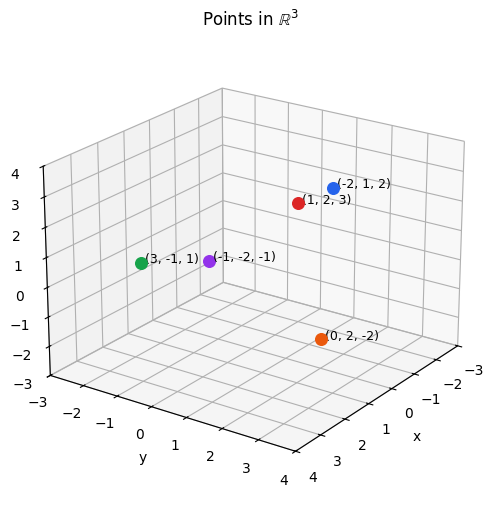
We can similarly identify elements of with points in 3-dimensional Euclidean space.
import matplotlib.pyplot as plt
from mpl_toolkits.mplot3d import Axes3D

points = [
    (1, 2, 3),
    (-2, 1, 2),
    (3, -1, 1),
    (-1, -2, -1),
    (0, 2, -2),
]
colors = ["#dc2626", "#2563eb", "#16a34a", "#9333ea", "#ea580c"]

fig = plt.figure(figsize=(7, 6))
ax = fig.add_subplot(111, projection="3d")

for (x, y, z), color in zip(points, colors):
    ax.scatter(x, y, z, s=70, color=color)
    ax.text(x, y, z, f" ({x}, {y}, {z})", fontsize=9)

ax.set_xlim(-3, 4)
ax.set_ylim(-3, 4)
ax.set_zlim(-3, 4)

ax.set_xlabel("x")
ax.set_ylabel("y")
ax.set_zlabel("z")
ax.set_title(r"Points in $\mathbb{R}^3$")

ax.view_init(elev=22, azim=35)
plt.show()
-dimensional Euclidean spaces
We can generalize these definitions beyond just two and three dimensions. We define the -dimensional Euclidean space to be the space of all -tuples of real numbers:
This space can be thought of a geometric space just like the two and three dimensional cases, although it is a bit harder to visualize. The power of mathematics is that one can often define objects like -dimensional spaces in a concrete and simple way algebraically, even though they may be hard to draw on a canvas or picture in our brains.
We will think of general -dimensional Euclidean spaces more in the future and focus on the two and three dimensional spaces first.