Linear algebra is the study of linear objects in mathematics. “Objects” here can mean several different things; the goal of this class is to understand that they are intimately related to each other.
Linear spaces: Lines or planes in our usual two or three-dimensional space are examples of what we’ll call linear subspaces.
Linear functions: Suppose an apple costs 2 dollars and a banana costs 1 dollar. The cost of buying apples and bananas is , which is what we call a linear function in and .
Linear equations: If we have 12 dollars total to spend on fruits, we obtain a linear equation .
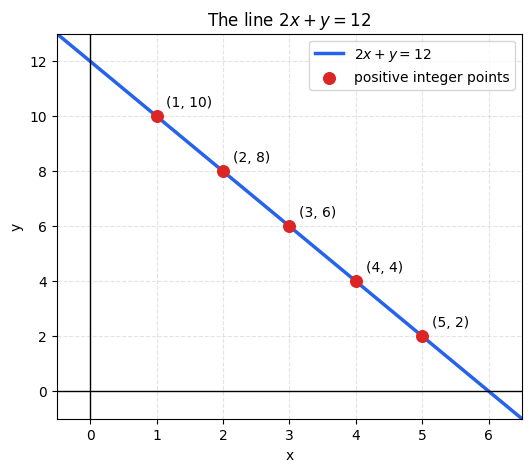
These three examples fit together in one. The equation form a straight line on the - plane, which is an example a simple linear space.
import matplotlib.pyplot as plt
import numpy as np

x = np.linspace(-0.5, 6.5, 200)
y = 12 - 2*x

fig, ax = plt.subplots(figsize=(6, 5))
ax.plot(x, y, color="#2563eb", linewidth=2.5, label=r"$2x+y=12$")

integer_x = np.arange(1, 6)
integer_y = 12 - 2*integer_x
ax.scatter(integer_x, integer_y, color="#dc2626", s=70, zorder=3, label="positive integer points")

for px, py in zip(integer_x, integer_y):
    ax.annotate(f"({px}, {py})", (px, py), xytext=(7, 7), textcoords="offset points", fontsize=10)

ax.axhline(0, color="black", linewidth=1)
ax.axvline(0, color="black", linewidth=1)
ax.set_xlim(-0.5, 6.5)
ax.set_ylim(-1, 13)
ax.set_xticks(range(0, 7))
ax.set_yticks(range(0, 13, 2))
ax.set_xlabel("x")
ax.set_ylabel("y")
ax.set_title(r"The line $2x+y=12$")
ax.grid(True, linestyle="--", alpha=0.35)
ax.legend(loc="upper right")
plt.show()