In Chapter 1.4, we learned how to add and scale vectors. Now, let’s look more closely at their geometry. How do we find the length of a vector? And how can we use vectors to find the distance between two points?
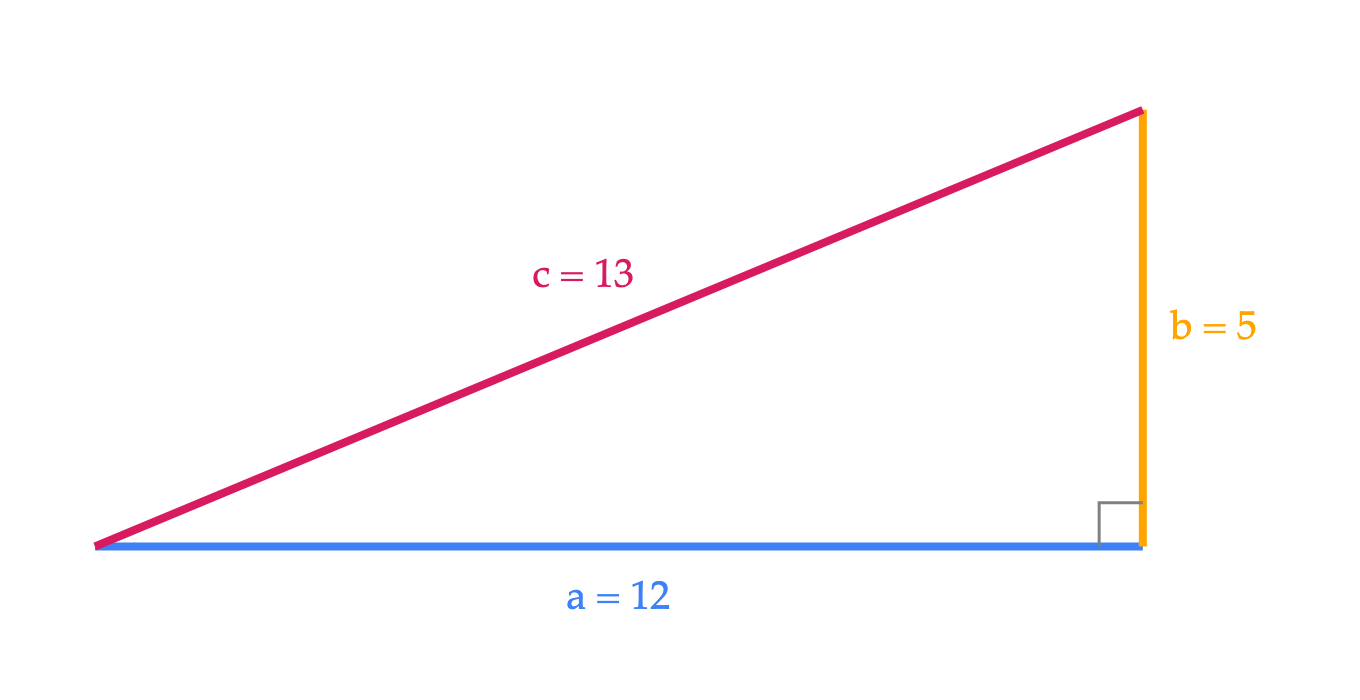
Throughout Chapter 1.5, we will refer to the familiar Pythagorean theorem. Recall, this says that if c is the length of the hypotenuse (the longest side) of a right triangle, and a and b are the side lengths of its two legs, then
a2+b2=c2.
For example, a right triangle with legs of lengths 5 and 12 has a hypotenuse of length 52+122=169=13.
import numpy as np
import plotly.graph_objects as go
from pathlib import Path as _PlotPath
import sys as _plot_sys

_notes_root = next(path for path in [_PlotPath.cwd(), *_PlotPath.cwd().parents] if (path / "myst.yml").exists())
if str(_notes_root) not in _plot_sys.path:
    _plot_sys.path.insert(0, str(_notes_root))
from plot_style import style_plotly as _style_plotly


def _vector_figure(vectors, vdeltax=0.3, vdeltay=0.3, vdeltaz=0.3):
    dimension = len(vectors[0][0][0])
    fig = go.Figure()

    for (start, end), color, label in vectors:
        start = np.asarray(start, dtype=float)
        end = np.asarray(end, dtype=float)
        delta = end - start

        if dimension == 2:
            fig.add_trace(go.Scatter(
                x=[start[0], end[0]], y=[start[1], end[1]], mode="lines",
                line=dict(color=color, width=4), showlegend=False,
                hovertemplate="(%{x}, %{y})<extra></extra>",
            ))
            fig.add_annotation(
                x=end[0], y=end[1], ax=start[0], ay=start[1],
                xref="x", yref="y", axref="x", ayref="y",
                showarrow=True, arrowhead=3, arrowsize=1.2, arrowwidth=3,
                arrowcolor=color,
            )
            if label:
                midpoint = (start + end) / 2
                fig.add_annotation(
                    x=midpoint[0] + vdeltax, y=midpoint[1] + vdeltay,
                    text=label, showarrow=False, font=dict(color=color, size=16),
                )
        else:
            fig.add_trace(go.Scatter3d(
                x=[start[0], end[0]], y=[start[1], end[1]], z=[start[2], end[2]],
                mode="lines", line=dict(color=color, width=8),
                showlegend=False, hoverinfo="skip",
            ))
            length = np.linalg.norm(delta)
            if length:
                unit = delta / length
                fig.add_trace(go.Cone(
                    x=[end[0]], y=[end[1]], z=[end[2]],
                    u=[unit[0]], v=[unit[1]], w=[unit[2]],
                    anchor="tip", sizemode="absolute", sizeref=0.28,
                    colorscale=[[0, color], [1, color]], showscale=False,
                    hoverinfo="skip",
                ))
            if label:
                midpoint = (start + end) / 2
                fig.add_trace(go.Scatter3d(
                    x=[midpoint[0] + vdeltax], y=[midpoint[1] + vdeltay],
                    z=[midpoint[2] + vdeltaz], mode="text", text=[label],
                    textfont=dict(color=color, size=16), hoverinfo="skip",
                    showlegend=False,
                ))

    return fig


def plot_vectors_non_origin(vectors, **kwargs):
    return _vector_figure(vectors, **kwargs)


def plot_vectors(vectors, **kwargs):
    converted = []
    for endpoint, color, label in vectors:
        converted.append(((tuple(0 for _ in endpoint), endpoint), color, label))
    return _vector_figure(converted, **kwargs)


def _set_vector_colors(fig, vectors, overrides):
    if np.asarray(vectors[0][0]).ndim == 1:
        vectors = [((tuple(0 for _ in endpoint), endpoint), color, label) for endpoint, color, label in vectors]
    dimension = len(vectors[0][0][0])
    trace_index = 0
    annotation_index = 0

    for vector_index, ((start, end), _, label) in enumerate(vectors):
        color = overrides.get(vector_index)
        if dimension == 2:
            if color:
                fig.data[trace_index].line.color = color
                fig.layout.annotations[annotation_index].arrowcolor = color
                if label:
                    fig.layout.annotations[annotation_index + 1].font.color = color
            trace_index += 1
            annotation_index += 1 + bool(label)
        else:
            if color:
                fig.data[trace_index].line.color = color
            trace_index += 1
            if np.linalg.norm(np.asarray(end) - np.asarray(start)):
                if color:
                    fig.data[trace_index].colorscale = [[0, color], [1, color]]
                trace_index += 1
            if label:
                if color:
                    fig.data[trace_index].textfont.color = color
                trace_index += 1

    return fig


def finish_vectors(fig, vectors, renderer="png"):
    _style_plotly(fig, renderer=renderer)
    _set_vector_colors(fig, vectors, {i: item[1] for i, item in enumerate(vectors)})
    return fig
fig = go.Figure()
for x, y, color in [([0, 12], [0, 0], '#3d81f6'),
                     ([12, 12], [0, 5], 'orange'),
                     ([0, 12], [0, 5], '#d81a60')]:
    fig.add_trace(go.Scatter(x=x, y=y, mode='lines',
        line=dict(color=color, width=4), showlegend=False, hoverinfo='skip'))
_style_plotly(fig, renderer='png')
for x, y, label, color in [(6, -0.6, 'a = 12', '#3d81f6'),
                            (12.8, 2.5, 'b = 5', 'orange'),
                            (5.6, 3.1, 'c = 13', '#d81a60')]:
    fig.add_annotation(x=x, y=y, text=label, showarrow=False,
        font=dict(size=20, color=color))
fig.add_shape(type='path', path='M 11.5,0 L 11.5,0.5 L 12,0.5',
    line=dict(color='gray', width=1.5))
fig.update_layout(width=680, height=350, margin=dict(l=20,r=20,t=20,b=20))
fig.update_xaxes(visible=False, range=[-0.6,14], constrain='domain')
fig.update_yaxes(visible=False, range=[-1.3,5.8], scaleanchor='x', scaleratio=1)
fig.show(scale=2)
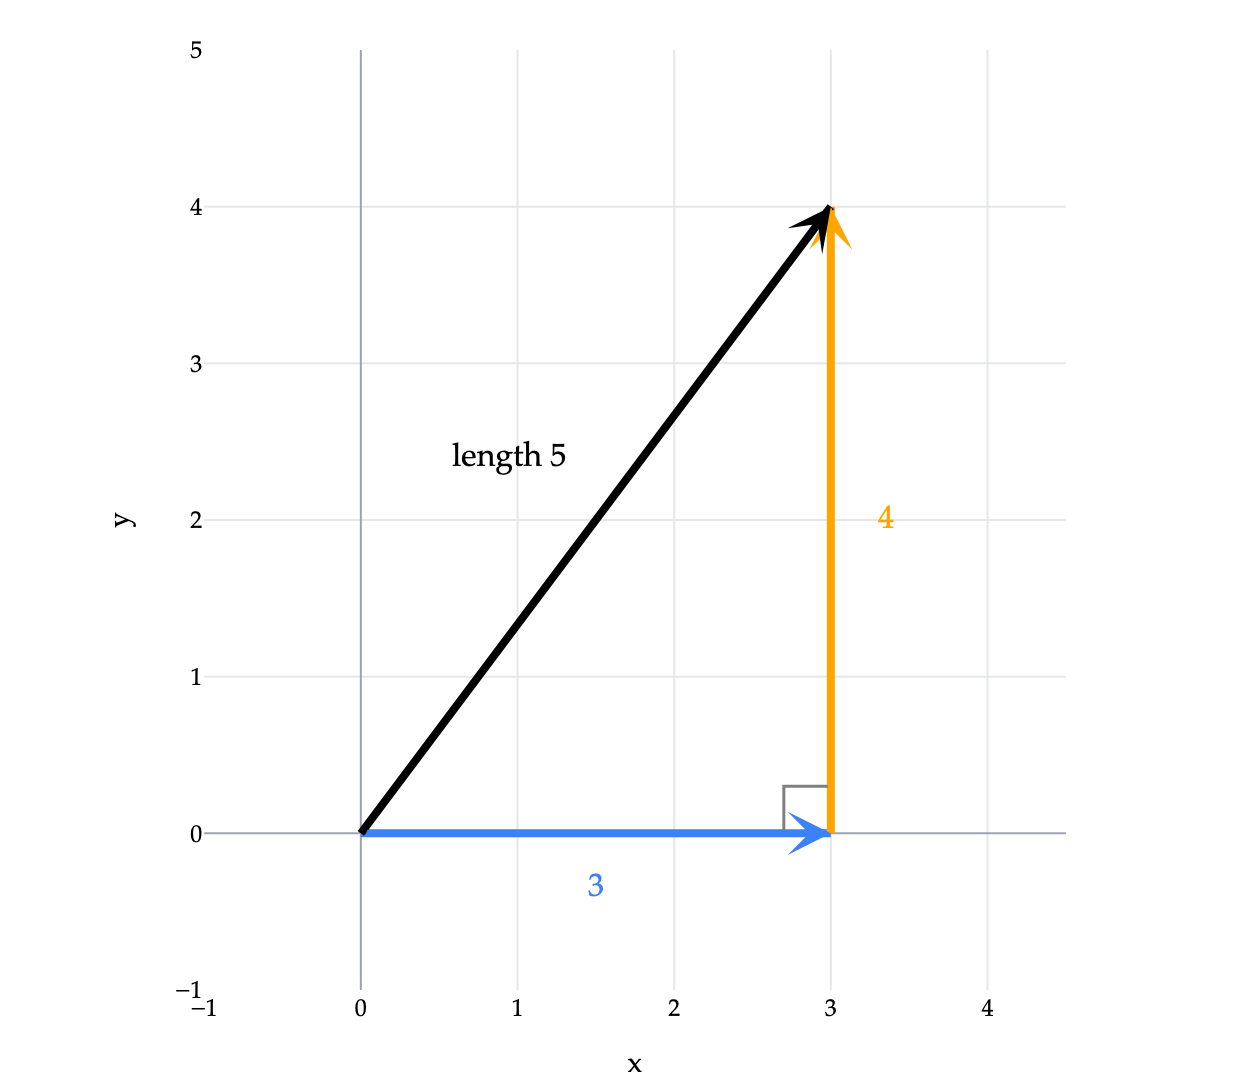
Now for our main point: finding the length of a vector. Let’s start with the vector
v=[34].
To draw v from the origin, we move 3 units to the right and 4 units up. The resulting arrow is the hypotenuse of a right triangle. The Pythagorean theorem tells us its length is
Drag the figure above to see the two right triangles mentioned below from different viewpoints.
We can find its length by applying the Pythagorean theorem twice. First, move 3 units in the x direction and 4 units in the y direction. The blue diagonal in the xy-plane has length
32+42=5.
The third component is −2, so we move 2 units downward. This vertical segment is perpendicular to the xy-plane, so we get another right triangle. Its legs have lengths 5 and 2, and its hypotenuse is our original vector. Therefore,
∥v∥=52+22=29.
Notice that this is the same as taking the square root of the sum of the squares of all three components:
The same pattern gives us a definition for any number of components.
As another example,
∥∥⎣⎡−120−2⎦⎤∥∥=(−1)2+22+02+(−2)2=9=3.
This vector has four components, but its length is 3. Those are different quantities! This is a vector in R4, which means we can’t visualize it, but we still measure its length by this definition.
What happens to a vector’s length when we scale it? If v has length 5, then 2v has length 10. So does −2v: the minus sign reverses the direction, but the arrow is still twice as long.
Why the absolute value in the last property? The length formula squares each component, so a factor of c contributes c2 under the square root. Taking the square root gives c2=∣c∣. The sign affects the direction, but the length stays nonnegative.
For now, to find the length of a linear combination such as 2u−v, compute the vector first, then take its norm.
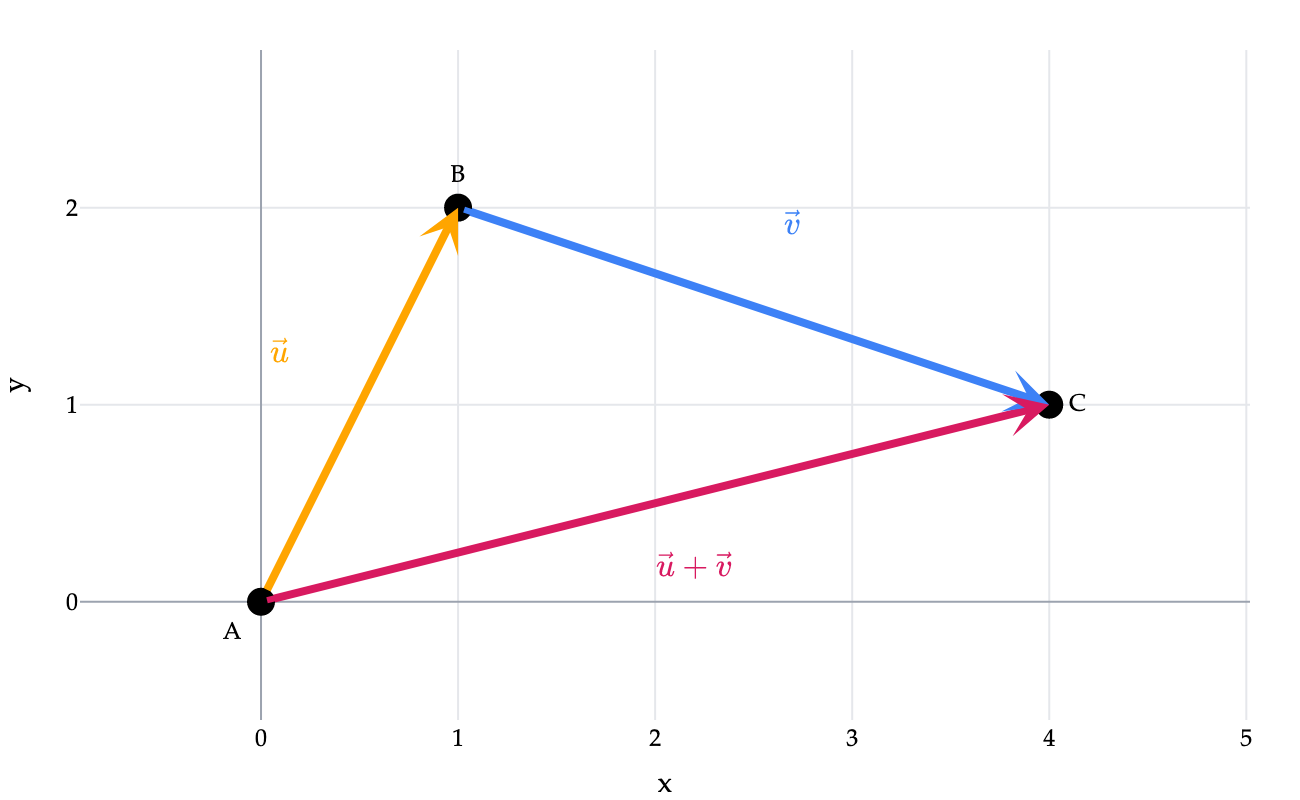
Notice something in the earlier activity. In Activity 1, we found that ∥u+v∥=6, while ∥u∥+∥v∥=10+210. The length of the sum is less than the sum of the lengths! This is an example of the triangle inequality.
Let’s describe this another way. Imagine traveling from point A to point B, then from point B to point C. Let u and v represent those two displacements, respectively. The direct displacement from A to C is the sum of the two vectors: u+v.
Key idea: The straight path cannot be longer than the path through B. We can state this formally.
The two sides can be equal. For example, if we travel 3 meters east and then another 4 meters east, our total displacement has length 7 meters. But if we change direction along the way, the direct route is shorter.
The picture explains the inequality in two dimensions. It also holds in Rn, for any number of components. We’ll use this fact without proving the general case here.
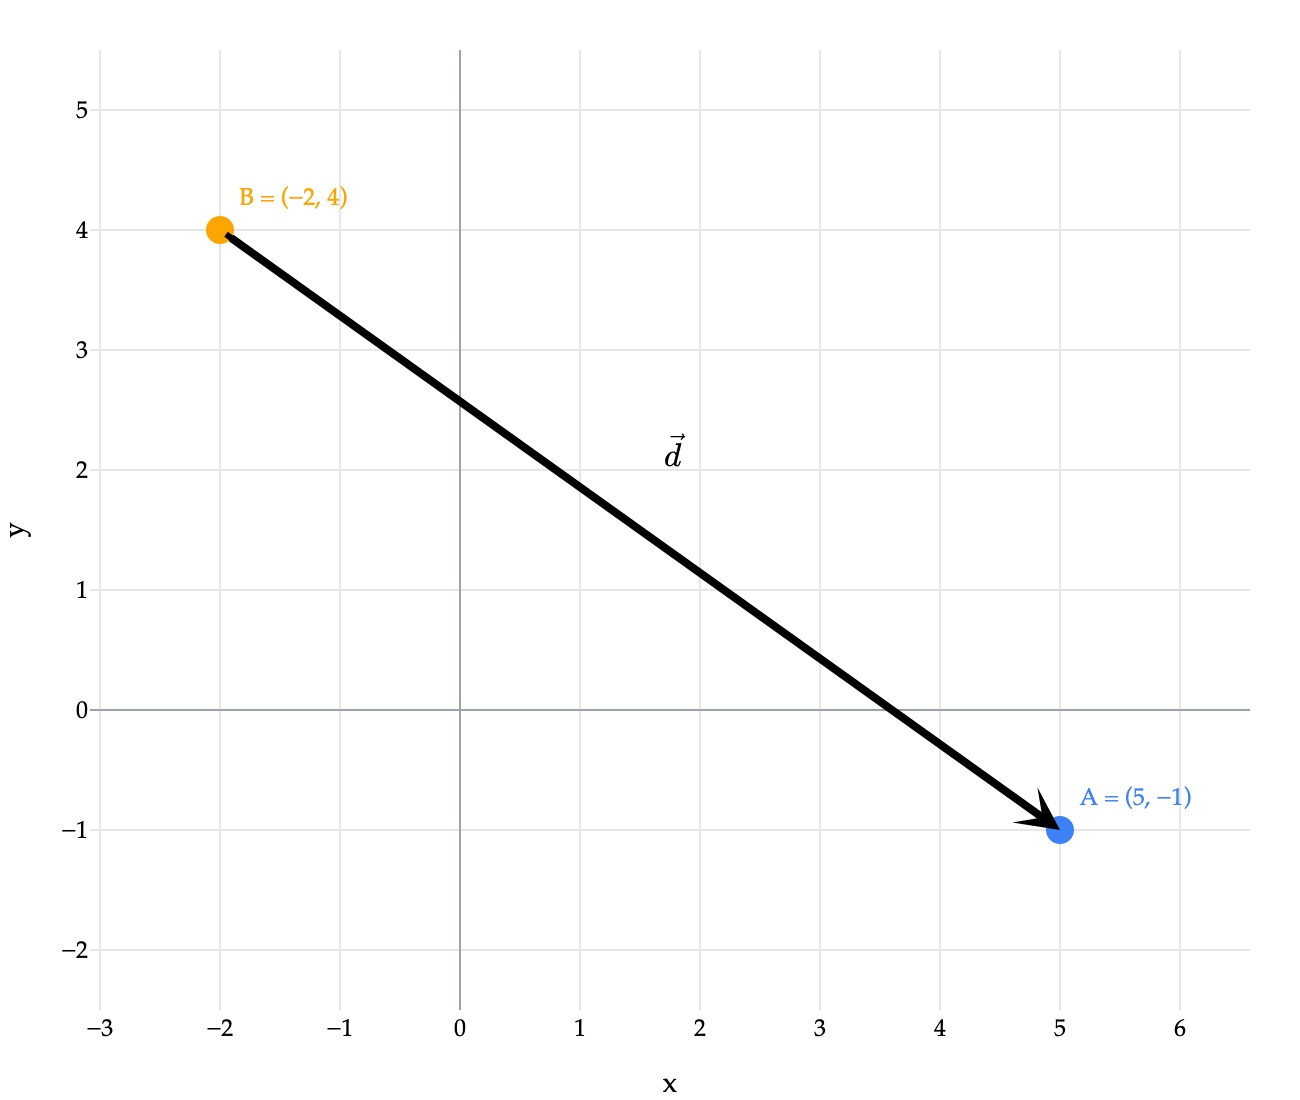
To find d, subtract the starting coordinates from the ending coordinates:
d=[5−(−2)−1−4]=[7−5].
The distance between the points is the length of this vector:
∥d∥=72+(−5)2=74 units≈8.60 units.
A path between these points may take a detour and be longer. The length of d gives the straight-line distance between the endpoints.
We sometimes use points and vectors interchangeably in coordinate calculations, but they play different roles: a point specifies a fixed position, while a vector describes a displacement. For example, B is a particular location in the plane, while d describes moving 7 units to the right and 5 units down, regardless of where we start.
The same method works with any number of coordinates: subtract corresponding coordinates, then take the norm. Reversing the direction gives the opposite displacement, −d, but the same distance, since ∥−d∥=∥d∥.
The first coordinate decreases by 4 units. The negative sign tells us which way to move; it does not make the distance negative. Its contribution to the squared length is (−4)2=16.
all point in the same direction, even though their lengths are different. We didn’t yet have a precise way to describe their shared direction.
One way to describe a vector’s direction is to use a vector of length 1 that points in that direction. We call a vector of length 1 a unit vector.
Let’s start with v=[12]. Its length is 12+22=5. To give it length 1 while keeping its direction, we can scale it by 1/5:
51[12]=[5152].
The resulting vector has length 51⋅5=1, and the positive scale factor preserves its direction. This is the unit vector that describes the direction of v!
The other two vectors have lengths 25 and 1005. Dividing each by its own length gives exactly the same unit vector. This makes their shared direction precise: two nonzero vectors point in the same direction exactly when they give the same unit vector after dividing by their lengths.
In general, to find a unit vector in the direction of any nonzero vector v, divide it by its length:
∥v∥v=∥v∥1v.
Dividing a vector by its length means multiplying every component by the same scalar, 1/∥v∥. We call this process normalizing a vector. The scaling property tells us that the result has length 1:
∥∥∥v∥v∥∥=∥v∥1∥v∥=1.
Since ∥v∥>0, the scale factor is positive, so the direction stays the same. We cannot normalize 0, since doing so would require dividing by 0.
In Chapter 1.6, we’ll use vector lengths to help measure angles between vectors.